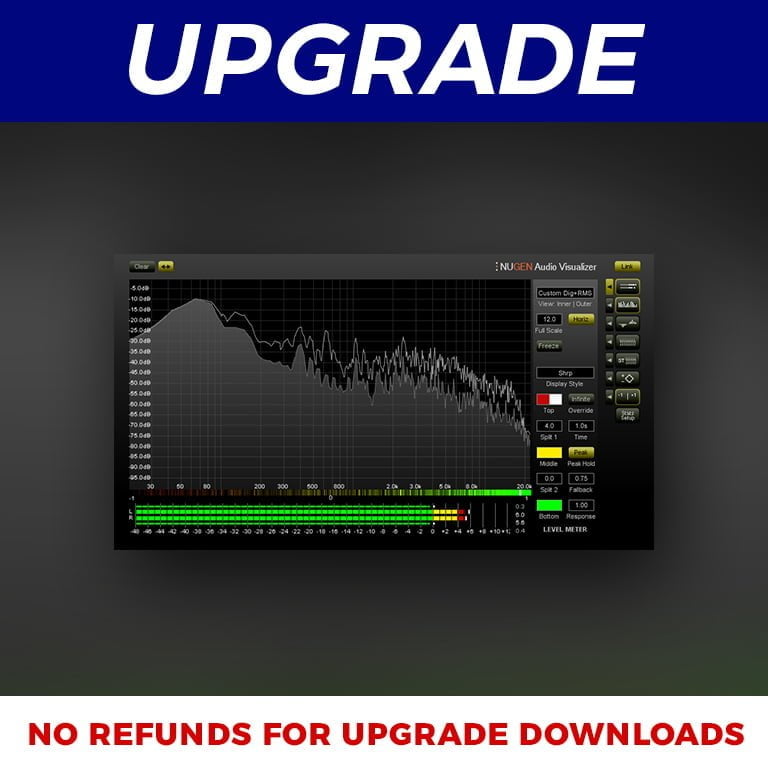
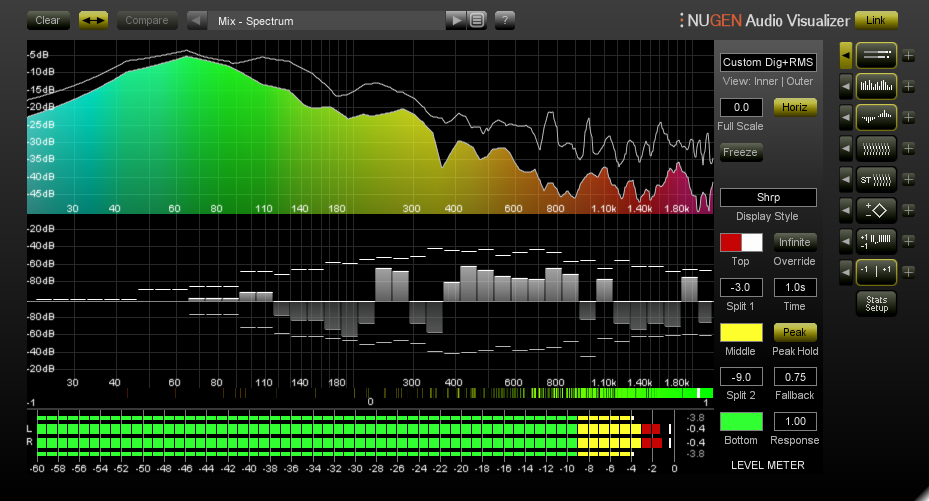
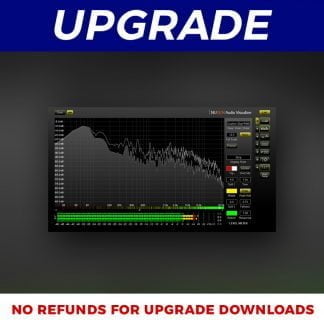
Visualizer’s intuitive display can be used for setting input levels, checking the phase relationship of your audio sources, and understanding the acoustics of a studio space, either by identifying problem frequencies or alerting you to unwanted noise in your signal path.
Use Visualizer to see and identify fundamental, characteristic or hidden frequencies in a recording, in order for you to EQ or even completely notch out problem frequencies. Detailed analysis of stereo placement, which can be particularly important for centering lead vocals, and for low end control.
Visualizer can be used for visual A/Bing of stereo spread and sonic fingerprinting, as well as checking phase relationships. Monitor your low frequencies and headroom, as well as examining dynamics and ensuring your project meets broadcast standards.
Clear and accurate phase analysis including overall Correlation, Correlation History, Vectorscope and Correlation by Frequency gives a highly accurate picture of your audio, allowing you to avoid potential cancellation problems and phase issues. Visualizer allows you to deliver robust, compliant audio with confidence.
Stereo and low frequency analysis ensures audio is suitable for TV broadcast by allowing you to easily monitor energy distribution and image stability.
Multiple frequency analysis views and comparison modes enable simple monitoring of stems to avoid masking dialog clarity issues.

